

01 /Key findings
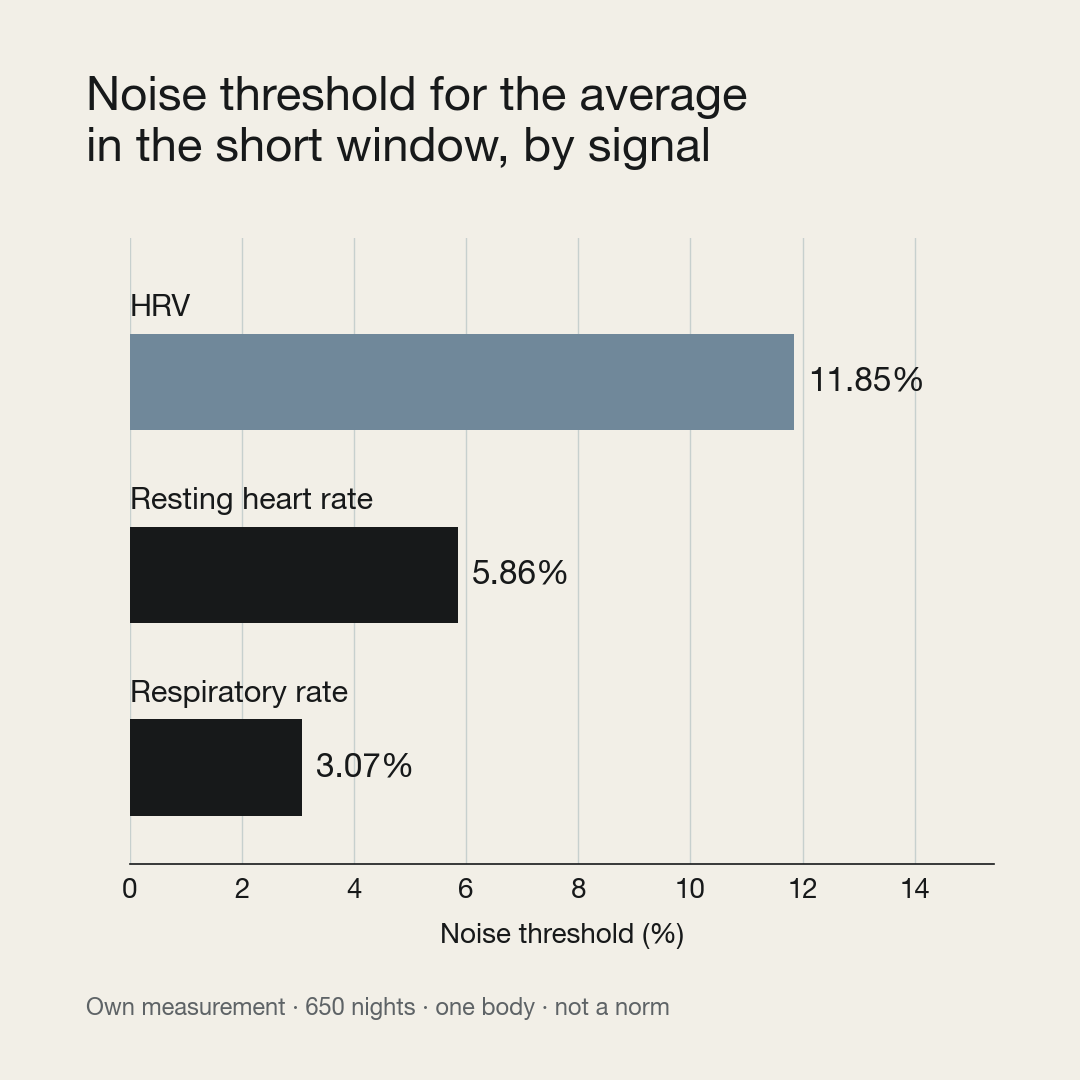
- HRV: over 650 nights, the median is 89 ms. A single night has to change 41.42% to stop looking like noise; the threshold for the short-window average is 11.85% (ruido.medido.json#hrv_avg_ms).
- Resting heart rate: over 650 nights, the median is 44 beats per minute. A single night has to change 20.66%; the threshold for the short-window average is 5.86% (ruido.medido.json#resting_hr).
- Respiratory rate: over 650 nights, the median is 14.3 breaths per minute. A single night has to change 8.86%; the threshold for the short-window average is 3.07% (ruido.medido.json#resp_rate).
02 /The myth: “If my recovery is low, something is wrong with my body today”
Short answer: not necessarily. This data does not measure recovery: it measures three overnight signals. In the series measured here (650 nights from one body), a single night has to change 41.42% in HRV, 20.66% in resting heart rate and 8.86% in respiratory rate to clear the noise. If none of your signals crossed its one-night threshold, that day can't be told apart from noise in those signals. This data does not give the cause of a low day.
03 /Which signal moved when your recovery came out low?
The recovery you see in the app is a different number: its calculation is not in these rows, and these thresholds are not its thresholds. What is measured here is three overnight signals: HRV, resting heart rate and respiratory rate.
If your recovery came out low today, the first useful question is another one: how much does your own signal move on any given night? You answer that with your own data, not someone else's. Look at which of the three signals moved that night, and by how much against your own baseline. If none of the three signals crosses its one-night threshold, that day can't be told apart from noise in those signals. The noise of the recovery score itself is not measured here.
Across these 650 nights, HRV has a median of 89 ms and a cv of 14.94%. The cv measures how widely all the nights spread around their typical value; it is not the average change from one night to the next.
Resting heart rate has a median of 44 beats per minute and a cv of 7.45%. Respiratory rate has a median of 14.3 breaths per minute and a cv of 3.2%. Each signal has its own noise thresholds.
04 /How was this noise measured?
It was measured with 650 nights of data from a single body, using three overnight signals: HRV, resting heart rate and respiratory rate. It is a first-party measurement. It is not a study with many people.
Each signal has two different questions, and each question has its own threshold. The first is whether one night on its own moved out of the usual range. For that one, the rcv is used, the threshold for a single night: for HRV, 41.42%. The second is whether the average of several nights changed. For that one, the window thresholds are used: for HRV, in the short window, 11.85%.
Both are percent changes in the signal itself. The 3.07% for respiratory rate is a percentage, not a count of breaths. A threshold is the smallest change you need to see before it stops looking like normal variation.
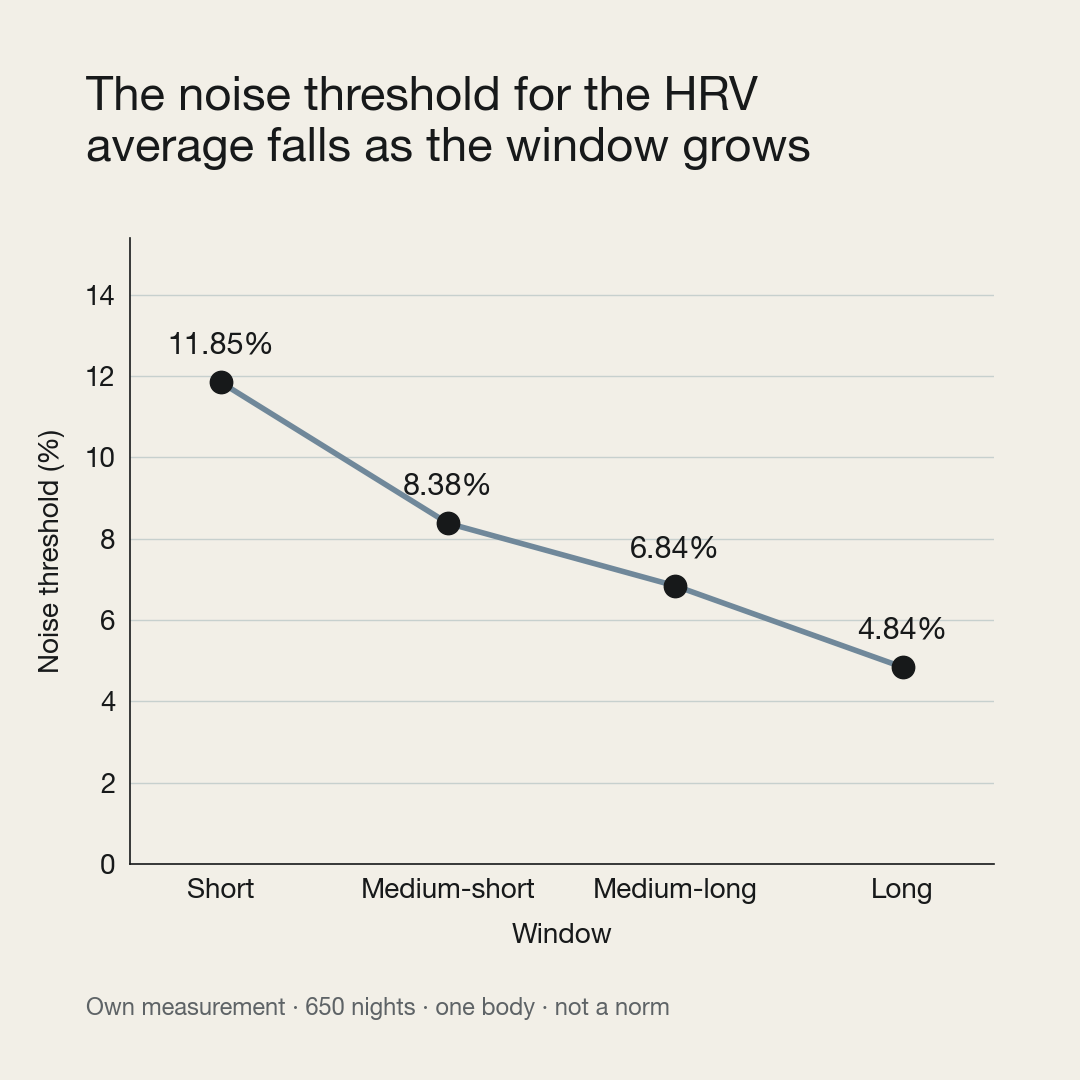
The file carries four windows. Here they are called short, medium-short, medium-long and long, from the briefest to the most extended. In all three rows, the threshold falls from one window to the next.
The table copies from the file's three rows, untouched, the columns used here. The cv, the rcv and the thresholds are percentages. The median is in each signal's own unit.
Status Measured
| Signal | Nights | Median | cv (%) | rcv, one night (%) | Threshold, short window (%) | Threshold, medium-short window (%) | Threshold, medium-long window (%) | Threshold, long window (%) |
|---|---|---|---|---|---|---|---|---|
| HRV (ms) | 650 | 89 | 14.94 | 41.42 | 11.85 | 8.38 | 6.84 | 4.84 |
| Resting heart rate (beats per minute) | 650 | 44 | 7.45 | 20.66 | 5.86 | 4.15 | 3.39 | 2.39 |
| Respiratory rate (per minute) | 650 | 14.3 | 3.2 | 8.86 | 3.07 | 2.17 | 1.77 | 1.25 |
Look at the HRV. The threshold falls from 11.85% to 8.38%, then to 6.84% and finally to 4.84%. What falls is the bar for the average. The series did not get any calmer: its cv is still 14.94%.
05 /What can I measure myself with my ring or band?
If you use Oura or WHOOP, these numbers belong to another body. Yours would have to come from your own nights. This measurement doesn't give them, and this text doesn't explain how to calculate them.
The reading works like this. For a single day, the yardstick is the one-night threshold. For a trend, the yardstick is the window threshold. In this body's HRV, the one-night rcv is 41.42% and the long-window threshold is 4.84%.
If you have your thresholds, the comparison works like this. A low day goes against your one-night threshold. An average of several nights goes against your window threshold. If the change fits inside the threshold, the data can't tell that day apart from the usual noise. If it goes past it, you know it moved more than your noise. You don't know why.
06 /Where the evidence ends
Here is what this data does NOT say:
- It is one body and 650 nights. It is not a norm for other people.
- It is not WHOOP's recovery formula. It doesn't explain why the app gives a specific number on a given day.
- These thresholds belong to three overnight signals. The noise in the recovery score itself is not measured here.
- It is not medical data and it doesn't explain the cause of a low day. It also doesn't say whether you should do anything.
Mental Work — all protocols
07 /What it means
A low recovery is not explained by these rows. What you can check is whether any of the three signals crossed its own one-night threshold. If none did, that day can't be told apart from noise in those signals. That threshold comes from your nights; the one in this table belongs to someone else.

Quick questions
Which signal moved when your recovery came out low?
The recovery you see in the app is a different number: its calculation is not in these rows, and these thresholds are not its thresholds. What is measured here is three overnight signals: HRV, resting heart rate and respiratory rate.
How was this noise measured?
It was measured with 650 nights of data from a single body, using three overnight signals: HRV, resting heart rate and respiratory rate. It is a first-party measurement. It is not a study with many people. Each signal has two different questions, and each question has its own threshold.
What can I measure myself with my ring or band?
If you use Oura or WHOOP, these numbers belong to another body. Yours would have to come from your own nights. This measurement doesn't give them, and this text doesn't explain how to calculate them. The reading works like this. For a single day, the yardstick is the one-night threshold.
Sources
- ruido.medido.json#hrv_avg_ms (own measurement, 650 nights)
- ruido.medido.json#resting_hr (own measurement, 650 nights)
- ruido.medido.json#resp_rate (own measurement, 650 nights)
To see each signal on its own:
Alejandro del PalacioAuthor · reviewed 2026-11-09
A measurement tool, not medical advice.
pieza_id p1-whoop-recovery-low-noise